Resale Flat Data Visualization & Analysis Dashboard
 Dashboard providing valuable insights through visualization and analysis of resale flat data in Singapore.
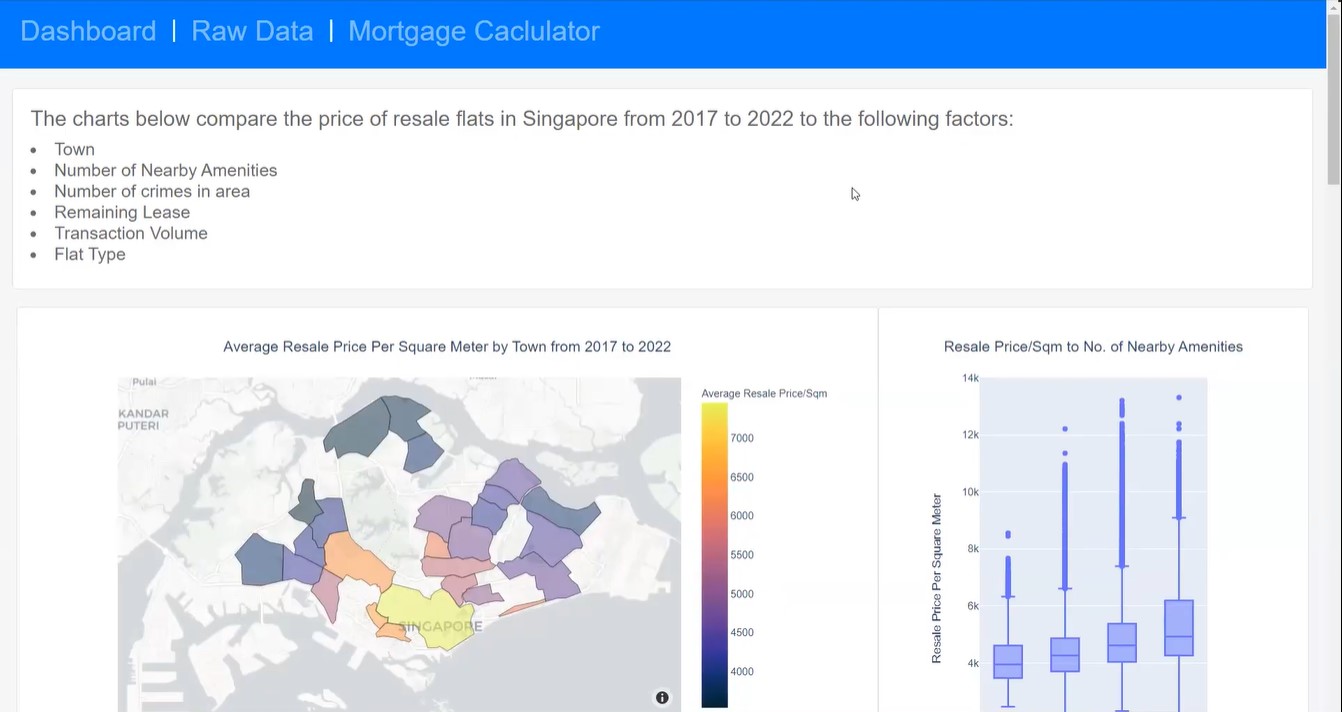
The dashboard provides insights into the resale flat market in Singapore, including trends in resale prices, locations, and more.
Built with Python packages: Pandas for data manipulation, Plotly for data visualization; Run on a Flask server.
The resale flat data was obtained from the Singapore government's data.gov.sg website. The data was cleaned and processed using Pandas to remove missing values and outliers. The data was then visualized using Plotly to create interactive plots that allow users to explore the data in more detail. Different types of plots were used to visualize the data, including line plots, scatter plots, and bar plots.
The main findings were that resale flat prices have been increasing over the years, with certain locations having higher prices than others. The dashboard also showed that certain flat types are more popular than others, with 4-room flats being the most common. The dashboard also included a heat map that showed the distribution of resale flats across Singapore.